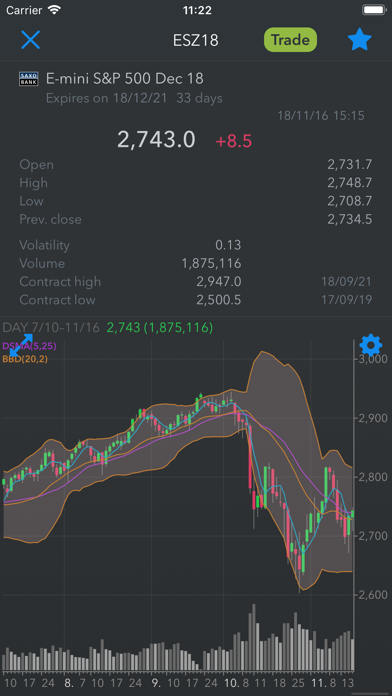
Use Pan Rolling Custom Chart app on your iPhone or iPad to analyze any stock price, exchange rate, commodity anytime anywhere. Start server technical indicators to get trade signals even when the app is not running.
Features:
・Display customized charts of your choice
・Access to global markets
・Display complex performance charts
・Run technical indicators on server 24x7
・Display charts by time zone in Tokyo, London, New York
・Many templates of the excellent traders’ charts
[Display complex performance]
You can display two or more charts in an overlay and compare the price movements.
It can be used as a leading indicator by confirming the correlation and inverse correlation and using the interlocking property of the app.
[Time zone: Tokyo, London, New York in different colors]
Color coding is applied to intra-day charts in order to indicate time zone in Tokyo, London, New York.
You can check the movement that becomes a milestone for each market.
Tokyo 9:00~15:00 (JST)
London 17:00~2:00
New York 23:00~7:00
[Technical indicators]
Simple Moving Average (SMA), Dual Moving Average (DSMA), Multiple Simple Moving Averages (MSMA), Envelope (ENV), Bollinger Bands (BBD), Ichimoku Kinko Hyo (IKH), Parabolic SAR (PSAR), Expotential Moving Average (EMA), Weighted Moving Average (WMA), Keltner Channel (KCH), Fast Stochastics (FSTOC), Slow Stochastics (SSTOC), RSI, MACD, Average Directional Index (ADX), Directional Movement Index (DMI), Kairi (KRI), Kairi ST/MA (KRISTMA), Momentum (MOM), Rate of Change (ROC), Williams %R (PCR), Psychological Line (PSL)


